
What Is a Martingale Strategy in Copy Trading? (Why the Chart Looks Smooth Until It Doesn't)
Martingale and grid-style money management can produce a smooth, steadily rising equity curve in copy trading — right up until a single move against the position wipes out months of gains. Here is how it works and how to spot it from public stats alone.
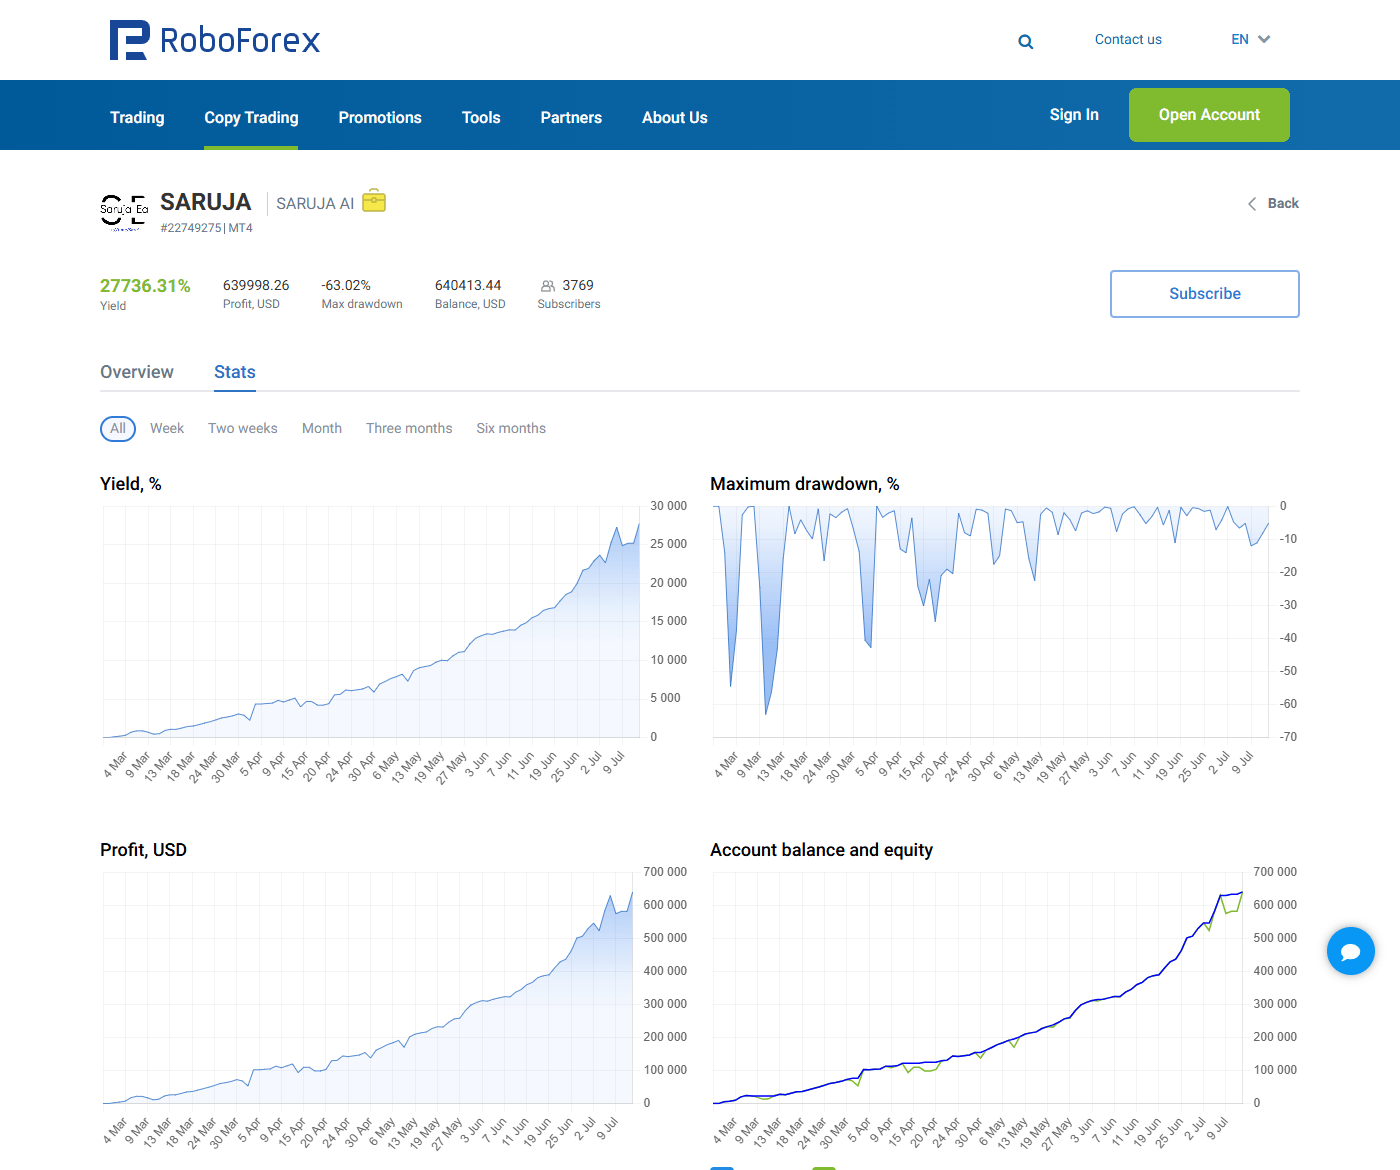
A martingale (or "grid") money-management style is one of the most common reasons a copy-trading account can show a beautiful, steadily rising balance for months — and then lose most of it in a single week. It isn't a scam and it isn't necessarily hidden from you; it's a specific, well-known approach to position sizing that trades a high chance of small, frequent wins against a small chance of a very large loss.
Quick verdict
Martingale-style trading increases position size after a loss, so the next winning move recovers the loss plus a profit. That produces a smooth equity curve in most market conditions, because most drawdowns do eventually reverse. The risk is the minority of cases where price keeps moving against the position — at that point, the lot size has grown large enough that a single unfavorable swing can erase months of gains, or the whole account. You don't need insider information to check for this pattern: it's usually visible directly in the public stats of any copy-trading strategy.
How martingale money management actually works
The core idea is simple. After a losing trade (or a trade that's currently underwater), the strategy opens the next position at a larger size than the previous one — sometimes doubling it, sometimes scaling it by a smaller multiplier, sometimes averaging into the same losing position instead of closing it. If the market reverses even slightly, the larger position recovers the earlier loss and locks in a profit. If the market keeps moving the wrong way, the strategy keeps adding size, betting that a reversal has to come eventually.
This is why martingale-based accounts often show high win rates — 90% or more of trades can close in profit, because the strategy is specifically designed to convert small losing streaks into wins. The trade-off is asymmetric: many small, frequent wins against an occasional, much larger loss.
Why the equity curve looks so good — until it doesn't
A martingale-style strategy tends to produce a chart that climbs steadily with only minor dips, because most price moves against the position do eventually reverse before the account runs out of margin. That's exactly the visual pattern that makes these strategies attractive to copy: a smooth, low-volatility-looking curve with a high headline return.
The problem is a version of what statisticians call the gambler's ruin problem: a strategy that keeps increasing its bet size after losses will, sooner or later, run into a losing streak long enough — or a single strong enough trend — that it can't recover from. The account doesn't need to be unlucky often. It only needs to be unlucky once, at the wrong position size, for the smooth curve to end abruptly.
How to spot it from public copy-trading stats
You don't need the strategy provider to label their method as "martingale" — the pattern is usually visible in three places on any copy-trading platform's public stats page:
- Maximum drawdown chart: look for occasional very deep spikes (often -30%, -50%, even -60% to -70%) in an otherwise calm chart. A strategy that manages risk more conservatively rarely produces drawdown spikes anywhere near that size.
- Recent period vs. all-time numbers: many platforms let you switch between "3 months," "6 months" and "all time." If the recent drawdown looks tiny (say, -10%) but the all-time drawdown is much larger, the account has likely already survived — or is overdue for — a much rougher stretch than its recent history suggests.
- Lot size behavior during losing streaks: if it's visible in the trade history, a lot size that grows noticeably after consecutive losses is the clearest direct signal.
If you still want to copy a martingale-style strategy
Martingale strategies aren't automatically a bad choice — they can be a legitimate part of a portfolio if you go in with clear eyes. The practical rules are:
- Treat the allocation as money you could lose completely, not as your primary savings.
- Never let one martingale-style account be your only copy-trading position — see our guide on portfolio diversification in copy trading for how to balance it against lower-risk strategies.
- Set a personal maximum allocation and stick to it, regardless of how good the recent chart looks — recent smoothness says nothing about what the next drawdown will look like.
- Check the platform's own risk warning and drawdown history before subscribing, not just the headline yield number.
FAQ
Is martingale trading illegal or against broker rules? No. It's a legitimate, widely used money-management style, and most brokers and copy-trading platforms allow it openly. The risk is financial, not regulatory.
Does a high win rate mean a strategy is safe? Not by itself. A high win rate combined with occasional very large losses is the exact signature of martingale-style sizing — the win rate looks great until one loss outweighs many previous wins.
Can a strategy provider "fix" a martingale approach to remove the risk? Not fully. The risk is structural — it comes from increasing position size after losses. A provider can cap the maximum size or add a stop-out level, which reduces but doesn't eliminate the tail risk.
Bottom line
A smooth, fast-rising equity curve is not proof of low risk in copy trading — sometimes it's proof of the opposite. Before copying any strategy, check the maximum drawdown history, not just the recent chart, and size your allocation for the account's worst realistic month, not its best one. For a full list of what to compare before copying any account, see our Forex Copy watchlist.
Related
View categoryRoboForex Copy Trading Leaders: Who Is on Top Right Now
A periodically refreshed look at the top of RoboForex's public Copy Trading rating — real yield, real drawdown numbers, and the risk pattern behind the best-looking chart.
Read article →
Copy Trading Portfolio Diversification: Why One Account Isn't a Portfolio
The biggest risk in copy trading is putting your entire allocation into one strategy, however good it looks. Here's how to actually diversify across risk profiles, not just across accounts.
Read article →