
Copy Trading Commission: Does a Higher Fee Buy a Better Trader?
The fee tables explain what a copy trading commission is. None of them say whether it buys anything. We read the fee and the record of every strategy on one platform, the daily curve of the hundred most-followed, and every leader with a follower on another: what the rate predicts, what it does not, and how much more than the headline number it actually costs.
Every explainer on copy trading commission tells you the same two things: the trader takes a cut of your profit, and the cut is a percentage. Then comes a worked example with round numbers, and the article ends. What none of them say is whether the percentage means anything - whether the trader asking 40% is, on any measure at all, better than the one asking 10%.
That question has an answer, and it needs a census rather than an opinion. Our system reads every strategy RoboForex lists on its copy-trading service once a day and keeps the record after a strategy leaves. On 12 September 2026 that was 5,170 listed strategies carrying 33,307 follower seats, each with a published fee, an all-time return, a worst single step and a registration date, and seven in ten also carrying an operator id that ties the account to the person running it. That is enough to ask what the fee predicts, and to answer it the same way twice on two different platforms.
The short version: the fee predicts nothing about the record, something about the crowd, and something about the trader's own money that points the wrong way.
What you are actually agreeing to
Before the numbers, the mechanism, because three parts of it do not appear on the strategy card.
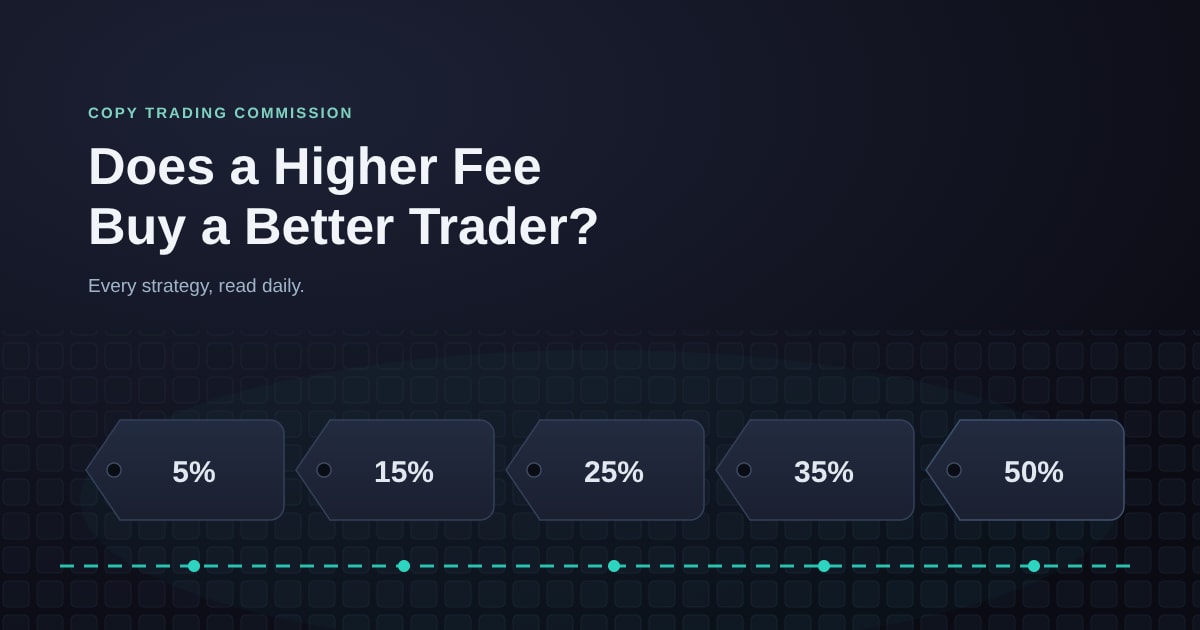
It is a performance fee on a schedule, not a haircut on your result. The platform's own documentation puts the range at "5% to 50% of net profit", paid "only if the overall result is positive", and a separate "No Commission" scheme sits beside it. That matches the list exactly: of the 5,170 strategies listed, 4,834 run the performance fee - every one of them at a multiple of five between 5 and 50, holding 31,711 of the 33,307 seats - and 332 run the no-commission scheme. A third scheme exists, a flat subscription charge in dollars per period rather than a share of profit, and four strategies use it.
It settles on a clock, and the trader sets it. The period is chosen from three options - one, two or four weeks - and 88.1% of listed strategies settle weekly, 3.3% every two weeks and 8.5% every four. The commission is reserved on the investor's account rather than transferred as it accrues, and moves to the trader at the end of each period - or, on unsubscribing, usually within a few minutes.
There is a high-water mark, and it is the most valuable line in the offer. The documentation is explicit: "Only profit above the previous highest result (High watermark) is used to calculate your commission", with a worked example - profit of $100 earns the trader $10 at 10%, a rise to $150 earns $5 on the $50 of new profit, and a fall back to $140 earns nothing. Without that clause the same fee costs far more; further down there is a measurement of how much.
One part is less comfortable. Subscription conditions "can be updated once every 24 hours", the change takes effect on Monday at midnight server time, and when a trader changes the rate, in either direction, "the new rate applies to all copied trades (old and new)". The fee you agreed to is the fee as at last Monday. It is not a hypothetical: 2,293 listed strategies - 44.4% of the list - are running an offer that took effect more than a week after the account was registered, and 473 of them moved onto that offer within the last thirty days.
What the list actually charges

The median strategy charges 25%. The average copied seat is signed up at 27.5%, because the seats do not sit where the strategies sit. 30% is the single most common rate, on 1,185 strategies holding 9,437 seats. At the top of the range, 383 strategies charge the maximum 50% - 7.4% of the list - and they hold 11.8% of all follower seats. Taken together, strategies charging 30% or more are 38.3% of the list and carry 55.3% of every copied seat on it. The platform's own count of recently added subscriptions - 5,332 seats over an interval it does not define - points the same way: 73.4% sit on a strategy charging 30% or more, though five strategies supply 43% of that total.
So most of the copying is happening on the dearer third of the list. The obvious explanation is that the dearer third is better. It is not.
A higher fee does not come with a better record

Rank the 5,170 listed strategies by fee and by all-time return and the correlation between the two is 0.002 - no directional relationship at all, on a sample that would have surfaced one down to about 0.03. Restrict it to the 2,432 strategies someone is actually copying and it is 0.023. Restrict it to the 2,602 with at least 180 days of record and it is 0.005. Compare the fee with the worst single step the platform reports - which is not the peak-to-trough fall, and flatters every strategy on the list - and it is 0.016.
For a sense of scale, the same calculation on the same list finds 0.211 between follower count and return - mostly because followers pile onto strategies that have already done well - and 0.063 between age and return. Those are weak relationships, but they are relationships. The fee is not one.
The tier-by-tier view says it in plainer language. The share of strategies underwater runs 41.0% among the free ones, 33.6% at 20-24%, 38.4% at 30-34% and 39.9% at the full 50%. The median all-time return peaks in the middle of the range, at +10.7% for the 20-24% tier, and falls to +3.4% at 50%. The share that have been wiped - minus 90% or worse and still inside the ten days before the rating drops them - is highest at the expensive end: 5.4% at 35-39% and 5.0% at 50%, against 2.9% across the list as a whole. It is a tilt rather than a ladder, though: the 1-9% tier sits third worst at 4.1%.
The natural objection is that something else - age, or a crowd that only pays up for proven names - is doing the work, so the same question was asked inside each age band and each follower band. In every age group from under-30-days to over-two-years, the correlation between fee and return sits between -0.081 and +0.067. In every follower group from zero to over a hundred, between -0.039 and +0.037. There is no slice of this list in which paying more has come with getting more. And the list flatters the expensive end to begin with, because the strategies that leave it are disproportionately expensive: 43.6% of the 1,251 that vanished in the last eighteen days charged 30% or more, against 38.3% of those still listed.
The mirror image is worth stating on its own: 766 listed strategies charge 30% or more and are underwater. That is 38.7% of every expensive strategy on the platform, and 3,537 follower seats are sitting on them.
What the fee does predict
Three things, none of them comfortable.
It predicts followers. The correlation between the fee and the follower count is +0.072, small but far too consistent to be chance. Which way that runs, a single day's snapshot cannot say: the same list has 2,293 strategies on an offer written after the account was opened, so a trader raising the rate once the followers arrived would leave the same trace as followers choosing the dearer trader.
It points the wrong way on the trader's own stake. The median balance on the trader's own account is $330 where the fee is under 25% and $236 where it is 30% or more, a rank correlation of -0.053 across the list. There is no ladder behind that - the free tier holds one of the smallest balances of the nine - and among the strategies anyone is actually copying the effect fades to -0.034. A tilt, not a rule - but not the direction a price signal would run in.
It is higher on second attempts. Of the 829 strategies registered since 1 August that carry an operator id, 171 belong to an operator whose earlier account had already lost half its value or taken a single fall of 90% or more - as far back as our record goes, 25 August, so a floor rather than a count. That is one in seven of every strategy listed since 1 August, and one in five of those we can trace to an operator at all. They ask for more: a median 30% against 25% for the other new listings, with 53.8% of them at 30% or above against 42.9%. Between them they hold 2,379 seats.
Run the question the other way and the point lands harder. Filter the list for the record a careful follower would actually accept - in profit all-time, a worst single step better than -15%, and at least 180 days old - and 329 strategies survive, 6.4% of the platform. Their median fee is 25%. That is the same as the list as a whole. Quality, where it exists, is not priced.
The rate on the card is the floor, not the price
A percentage taken again and again is not a percentage taken once: every settlement removes money that would otherwise have kept compounding, so the trader's share of your final gain grows with the size of the gain and the length of the record - before anything else happens at all.
We took the 100 most-followed strategies, pulled each one's full published yield curve, and ran the fee through it under the platform's own rule: settle on that strategy's own period, charge only on cumulative profit above its previous high. 93 had a usable curve, between them carrying 14,572 seats, and 76 of those ended their curve in profit - the only ones for which "a share of the gain" means anything. The model has the follower joining on the curve's first day and holding to the last: the longest exposure to the fee, and the only entry that can be read off a public curve without inventing one.

Across those 76, against a median headline rate of 30%, the median share of the follower's entire gain taken by the fee was 46.4%. Weighted by seats it was 47.8%. 73 of the 76 cost more than the number on their card, and in two of them the fee took more than the whole of the gain.
Most of that gap is arithmetic, not drama. Replace every curve with a perfectly smooth line of the same total return over the same dates - no dips, nothing given back and re-earned - and re-run the same rule: the median share taken is still 41.0%, and 71 of the 76 still cost more than their headline. The compounding alone does it. Vendo DD50 is the clean case: 30% on the card, 49.1% of the gain taken, and 48.9% on a smooth line of the same return. S1 AUDCAD/EURGBP is the same story lower down the scale: 15% on the card, 18.9% taken, 18.9% smoothed.
Giving money back and making it again is the second mechanism, and it is what separates the ordinary cases from the ugly ones. Its median contribution across the 76 is zero, but 18 of them pay more than five extra points for it, and at the top of that group it dwarfs the arithmetic. FFX STradegy would have paid 27.1% of its gain on a smooth line; on its real curve it paid 75.9%. HONEY MAKER would have paid 51.5%; it paid 71.2%. Those are strategies that made money, gave it back, and made it again, each new high paying the trader once more - the shape a martingale-style strategy produces on purpose.
What that looks like from the follower's side:
- HONEY MAKER (804 seats, 50%, 605 days of record): +15.2% for the strategy, +4.4% for the modelled follower.
- FFX STradegy (423 seats, 25%, 1,301 days): +25.9% became +6.3%.
- Vendo DD50 (368 seats, 30%, 817 days): +464.9% became +236.6%.
- S1 AUDCAD/EURGBP (254 seats, 15%, 1,179 days; not in the chart above, which shows only the seven most-followed): +80.6% became +65.3%, the smallest gap of the four.
That is also what the high-water mark is worth. Run the same strategies without it - a fee on every profitable period, losing periods forgotten - and the median share of the gain taken rises from 46.4% to 70.6%, with the share of cases where the fee exceeds the entire gain going from two in 76 to 17.1%. Under that rule HONEY MAKER's modelled follower finishes at -8.5% on a strategy that made 15.2%.
And the watermark does not make the fee free of risk. 16 of the 93, carrying 1,903 seats, ended their curve below where they started and had still paid the trader along the way, because they made new highs first. On TRDR XAUUSD BOT (327 seats, 30%) a strategy down 8.7% leaves the modelled follower down 13.0%. On GOLDEN APPLE (153 seats, 20%), down 47.1% becomes down 54.8%, with fees worth 22.7% of the original stake paid out en route.
Three things this model is not. The curve is the trader's own account, not any follower's statement - proportional copying tracks it closely but not exactly, and nothing here charges spread, swap or platform costs on top. The curves are close to daily without being complete, so about one settlement in five falls inside a gap of more than three days; moving the settlement clock through every phase of the week shifts the median by a tenth of a point. And there is no settlement at the exit: profit above the last high on the final day goes uncharged here, while a follower who unsubscribes that day pays on it within minutes, so for them the shares above are, if anything, slightly low.
The same question on a crypto platform
Bybit's copy trading prices itself completely differently, and gives the same answer.
Reading every Bybit leader with at least one follower on the same day - 1,770 of the 7,079 on the board, holding 17,872 seats - the median profit share is 10%, and 87% of them charge exactly that. The clustering is structural: the ratio is capped by the trader's rank, and the rank table on Bybit's profit-sharing page puts Cadet and Bronze at 10%, Silver at 12% and Gold at 15%. Reality is untidier than the documentation at both ends - 144 leaders charge less than 10% and 90 of those charge nothing at all, while 62 charge more than the 15% ceiling, some of them 50% - and we have no explanation for either group that we would stand behind.
The average copied seat there is signed up at 10.12%, against 27.5% on the forex one. Those are not the same price, though. Bybit's Classic copy trading has no high-water mark: losses offset profits only inside a single Saturday-to-Friday cycle, and a losing cycle refunds what was pre-deducted rather than carrying anything forward. That is the third bar in the chart above: on the forex curves it was the difference between 46.4% and 70.6% of the gain. A lower rate on a card, under a rule that starts from zero every week, is not straightforwardly cheaper.
It buys the same nothing. The correlation between a Bybit leader's profit share and their 90-day return is 0.015; against the platform's own published figure for what their followers earned over those 90 days - a number the forex platform does not publish at all - it is 0.013. With seven leaders in eight on the same rate there is little variation to correlate against, so this is a thinner test than the forex one, but every cut of it points the same way. The relationship that does show up is the familiar one: profit share against follower count, +0.079.
If anything it is the middle that looks best. Over the same 90 days the 86 leaders charging above 10% show a median follower P&L of -$43, with 57.0% of them negative; the 144 charging below 10% show -$4, with 54.2% negative; the 1,540 at the standard rate show $0, with 42.5% negative. One thin relation does run in the fee's favour - the higher the share, the shallower the 90-day drawdown, -0.057 - which on a three-month window is not much to carry. Across all 1,770 leaders those P&L figures sum to about -$1.88 million over the period, most of it from a handful of large books - a loss we have already totalled leader by leader. Here it is enough that the cheaper platform is not the profitable one either.
What to do with this
The fee is the one term of a copy-trading subscription that is certain. The return is not. Everything above says the two are unrelated, so the fee should be treated as a cost to minimise rather than a signal to read.
Three practical consequences:
- Read the settlement period, not just the rate. A 25% fee settling every 28 days and a 25% fee settling weekly are different prices for the same strategy, and the difference grows with how much the strategy moves.
- Price the fee against the curve, not the card. What it takes grows with the size of the return, the length of the record and every dip made back: above, a 30% card cost 49% of the gain on a smooth curve and a 25% card cost 76% on a jumpy one.
- Check whether the rate you signed up for is still the rate. It can be changed once a day, takes effect on Monday, and applies to trades already open.
None of which decides whether to copy anyone at all. That still comes down to the things the whole-list statistics already showed - a third of the list underwater, a median barely above zero, survivorship doing the flattering - plus how much of your money one strategy gets. The fee is just the part you can work out in advance, and it is larger than it looks.
Every figure above is our own computation across the figures RoboForex and Bybit publish per account, as recorded on 12 September 2026; the RoboForex panel has read the full list daily since 25 August 2026, and the Bybit universe is every leader with at least one follower on that day's board. RoboForex returns are all-time, Bybit's are 90-day, and the two are not directly comparable. The fee simulation is a model of the published rule against published curves, not any real account statement. Shares and counts will move with every reading. Copy trading carries real risk, and nothing above predicts future performance.
Related
View category
Copy Trading Statistics: Is Copy Trading Profitable When Every Strategy Is Counted?
Broker pages answer whether copy trading is profitable with one leader’s chart. We read every strategy RoboForex CopyFX lists, every day, and summed the whole list: how many are underwater, where the followers’ money actually sits, how fast the list turns over, and why a long record proves survival rather than skill.
Read article →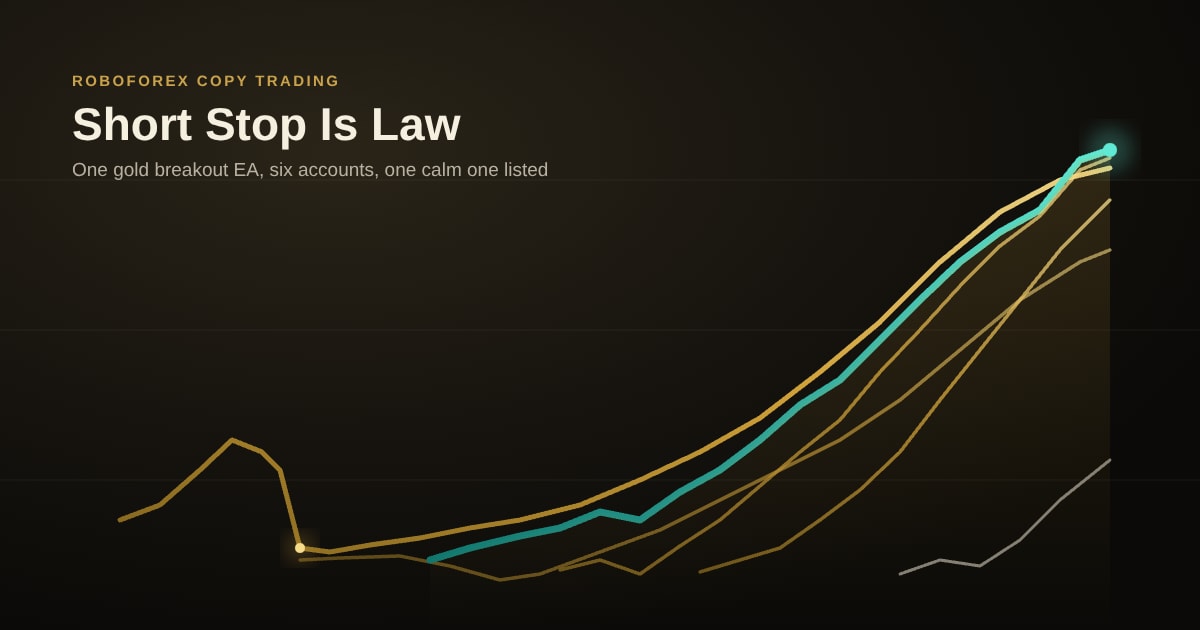
Short Stop Is Law Review: A Gold Breakout EA on Six Accounts
Short Stop Is Law sits high in our CopyFX rating on a record with no double-digit fall. The same trader runs the same gold breakout EA on five other accounts, and three of them have already been through falls the listed one has not. What the whole family shows, what the fee history says, and how to size it.
Read article →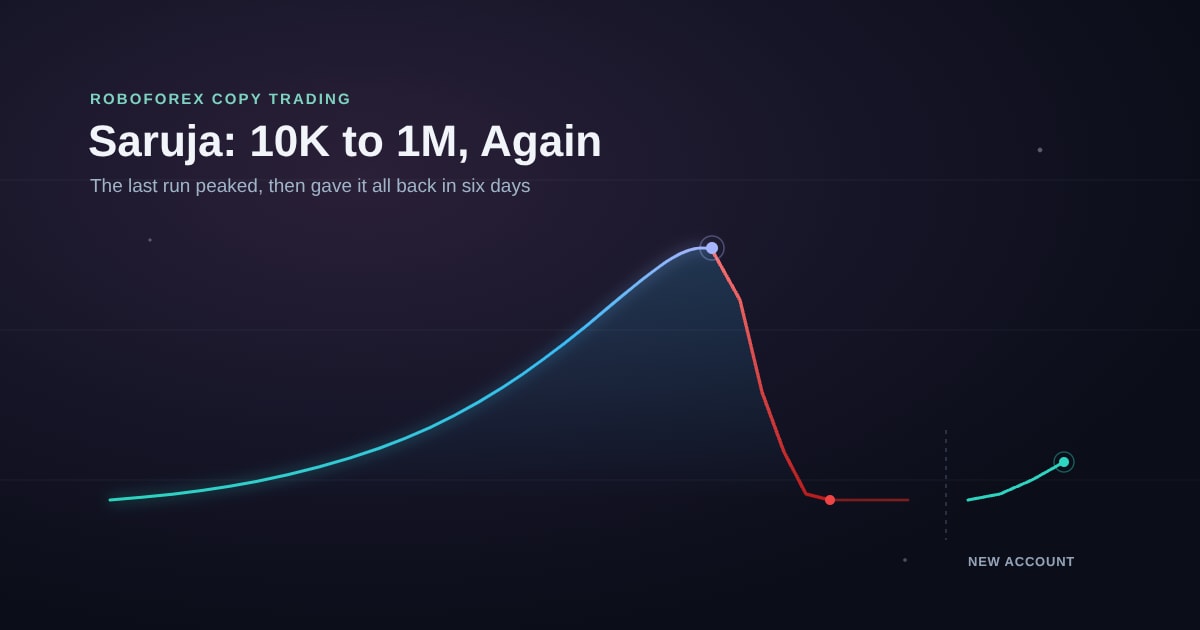
Saruja 10K to 1M Journey: The New Account, and What the Last One Did
Trading has started on the account behind the Saruja 10K to 1M journey. The same operator’s last account made a very large return and then gave all of it back in under a week — which is both the case for copying this one and the reason to keep it small.
Read article →