
Does Copy Trading Work? The Same Question Measured on a Forex and a Crypto Platform
Broker pages answer whether copy trading works with one leader's chart. We asked the follower's version of the question on two platforms: every RoboForex copy-trading strategy with a follower, every day a copy could have started, the fee settled the way the platform settles it - and every Bybit leader with a follower, where the platform itself publishes what the copiers made.
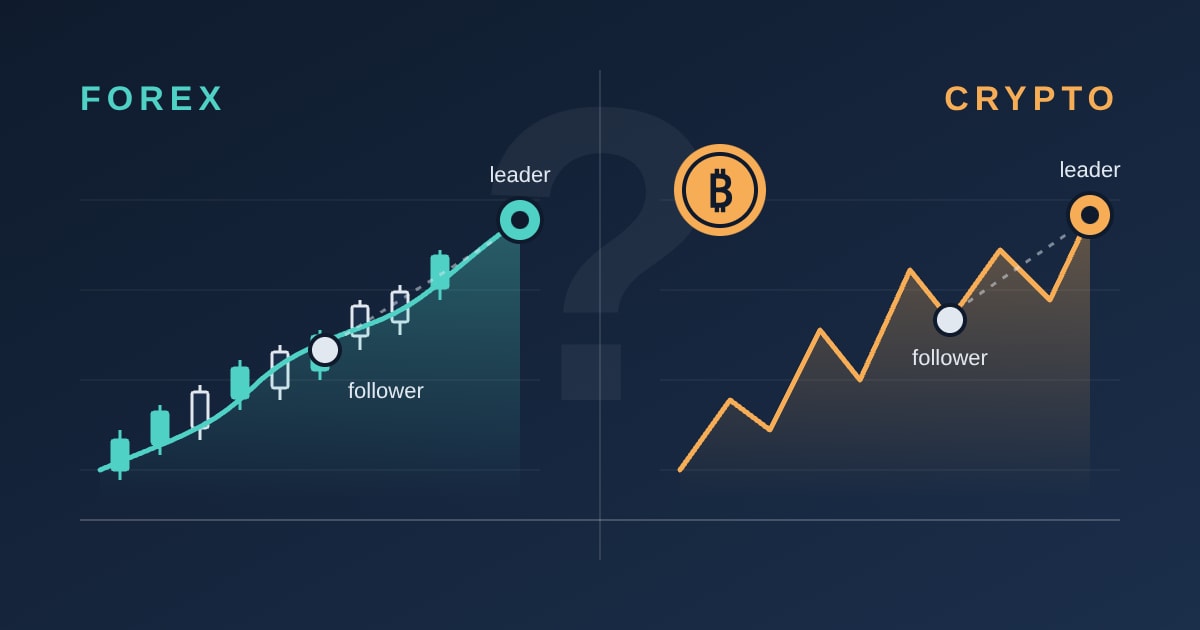
Ask whether copy trading works and you will be shown a chart. It is one leader's chart, chosen because it goes up, and it answers a question nobody asked. Whether copy trading works is not a question about the leader. It is a question about the person who pressed the button - on the day they pressed it, for as long as they held on, after the fee.
That version of the question can be measured, and we measured it on two platforms that sit on opposite sides of the market. On the forex side, RoboForex's copy-trading service, where the rating we publish is scored from a panel that records every listed strategy daily, and where every strategy's full curve is public: we took every strategy that has a follower, cut its curve into every ninety-day copy that could have started on any day, and charged the trader's fee on each the way the platform charges it. On the crypto side, Bybit, which publishes for each leader what the people copying them collectively made: we read that figure for every leader with a follower and added it up. The forex data is as of 13 September 2026, the crypto data as of 12 September 2026.
The one-line answer: on both platforms a little over half of the followed leaders were up over the last ninety days, the middle one made about nothing, and the followers' results ran behind the leaders' - by the fee, by when they joined, and by the leaders who fell out of the list before the reading.
What "work" has to mean
Three things stand between a leader's chart and a follower's balance, and they are the same on both platforms.
The first is the entry. The card shows the leader's return since the account opened. A follower who joins in month eighteen of that curve does not receive months one to seventeen; they receive whatever the curve does after their entry, and people tend to enter after the part that looked good. The second is the fee. On the forex platform the trader takes a share of the follower's profit at every settlement - weekly, on nearly nine strategies in ten - and a fee charged on the way up is not refunded on the way down, so a follower can pay it and still finish behind. The third is the list. Both platforms remove accounts - on the forex side once the yield has sat at minus 90% for ten days - so what a reader browses is what survived, and an average taken from survivors flatters.
Ninety days is the horizon used throughout because it is the one Bybit reports: its board publishes no window longer than that. On the forex side the card shows an all-time counter, so the ninety-day figures there are ours, cut from the daily curve. Where an account is younger than ninety days, both sides show its whole life.
Forex: what a ninety-day copy returned
On 13 September 2026 the RoboForex list held 5,134 strategies, of which 2,428 had at least one follower, holding 33,441 follower seats between them. That is the universe: a strategy nobody copies has no follower whose result could be asked about. Our panel adds 371 more that had followers when we last saw them and have since left the list; the platform keeps serving their curves, so they can be counted, and they matter for the reason the previous section gave.
The last ninety days, strategy by strategy. Of the 2,421 followed strategies with a curve, 56.5% were up over their last ninety days - or their whole life, where shorter - and 64.6% of the seats sat on those; the median strategy made +2.5%. Restricting to the 1,790 with a full ninety days of history, 54.1% were up, 7.0% did not move at all, and 38.8% were down. After the trader's fee, 51.3% left a follower who had held the whole window in profit, and the seats on those were 57.7% of the seats with a full window.
Add the 371 departed and the picture darkens as it should: only 17.0% of them were up over their final ninety days - or their whole life, where shorter - 145 had lost 90% or more, and the median had lost 71.8%. Listed and departed together, 51.3% of followed strategies were up over their last ninety days, with 57.6% of the seats on them.
Every day a copy could have started. The last ninety days are one draw. The curves allow every draw: for each of the 1,928 strategies with a full window, listed plus departed, every day from the first point to ninety days before the last is an entry day, which gives 783,139 ninety-day copies. Each is settled with the strategy's own fee under the platform's rule - charged at each settlement period counted from the entry day, only on profit above its previous high, and once more at the exit.

Weighted by follower seats, so that a strategy with 800 followers counts 800 times a strategy with one, 72.0% of those copies ended above zero before the fee and 69.3% after it; 6.2% lost half or more; 2.7% did not move because the account was idle; the median copy made +6.8% after the fee. Give every strategy the same weight instead and the share in profit drops to 60.2% - the seats sit disproportionately on the strategies whose windows were good. 62.9% of strategies had most of their windows in profit; 122 never had a single one; 262 had every one in profit.
The fee's mark is visible in the shape. It moves copies from the right tail toward the "0 to 10" column, which grows from 21.0% to 26.2%, and it moves 18,361 copies - 2.3% of all of them - from above zero to below it. Those are windows in which the fee was charged on a high the curve then gave back. 1,126 strategies had at least one.
Two cautions. The windows overlap - neighbouring entry days share most of their path - so 783,139 is not a count of independent trials, and the per-strategy shares are the honest units. And the departed only reach back to 25 August, when the panel began; strategies that blew up before then are in no curve here, so every figure in this section is, to a degree we cannot yet measure, an average of survivors. On the 138 departed with a full window, only 44.9% had most windows in profit and one seat-weighted copy in five, 20.3%, lost half or more. A list that turns over in weeks needs months of readings before a survival curve can be drawn, and the numbers above will come down as it fills.
When the follower joined. The simulation can ask what a real follower does, which is to join after the chart has looked good. Sorting entry days by what the same curve had done in the previous ninety days, on the listed strategies, window by window: after a quarter of +20% or more, 69.0% of the next ninety days ended in profit after the fee; after a modest quarter, 70.0%; after a losing quarter, 49.3%; after a quarter in which the curve did not move, 10.6% - because 82.7% of those accounts stayed idle. Joining on a day when the curve stood at a new high ended in profit 68.4% of the time.
So chasing a strong chart did not lower a follower's odds of a positive quarter on this list. It raised the size of the bad ones: 4.2% of copies started after a strong quarter lost half or more, against 1.9% after a modest one, and with the departed included and the seats weighted, 15.8% of copies started after a strong quarter lost half or more in the next one, against 3.5% after a modest one. Most of that tail is one strategy. An account named SARUJA AI carried 2,559 seats when we last saw it on 2 September; two-thirds of its ninety-day windows had ended in profit, the median at +193%, and the last one ended at minus 99%. What happened to it is its own story.
What moved the odds on this list. The same cuts we apply to the crypto board below point the same way here. Strategies with a hundred or more seats had most of their windows in profit 88.9% of the time, against 56.6% for those with one to four seats. A worst step of 50% or more - on the platform's own measure, which is a single move and flatters - went with 8.5% of seat-weighted copies losing half, against 0.1% where the worst step had stayed under 15%. And age did nothing: strategies older than two years had the lowest share with most windows in profit, 60.2%, and the most idle ones.
The card is not the copy. Of the 1,790 listed strategies with a full window, 1,218 showed a positive all-time return on the card. For 224 of them, carrying 2,114 seats, no more than half of the ninety-day copies had ended in profit after the fee; for 406, carrying 7,040 seats, the last one had not. The reverse happens too: 156 strategies with a negative card had most of their windows in profit. The card and the copy agree in rank - Spearman 0.58 - and disagree on about one strategy in five.
Crypto: what the copiers actually made
Bybit's board answers the follower's question directly, which is why it makes the other half of this piece. For every leader it publishes the collective profit of the people copying them over the trailing ninety days. On 12 September 2026 the board listed 7,079 leaders; 1,770 had at least one follower, holding 17,872 seats. Our rating of that board is scored from the same fields; here they are summed.
The leaders. 943 of the 1,770, 53.3%, showed a positive ninety-day ROI, and 63.0% of the seats sat on them; 809 were down; the median was +1.4%. 603 leaders, 34.1%, had a drawdown of 50% or more inside the window, with 28.7% of the seats on them. The board's ROI is the leader's own account over the leader's own equity, the same kind of figure as the forex curve, and it came out in the same place: half up, the middle one flat.
The followers. Where the forex platform is silent, Bybit's field speaks, with two caveats. For 384 of the 1,770 leaders it serves an exact zero, including visibly active accounts, and we have watched it flip from a real negative to zero between readings, so those are counted as no reading rather than break-even; and whether the figure is before or after the leader's share the platform does not say. Among the 1,386 leaders with a reading, the followers' pool was in profit for 604 - 43.6% - and in loss for 782. By seats, 47.3% of the seats with a reading sat on a pool in profit and 52.7% on a pool in loss. The median pool was minus six dollars. Summed, the pools came to minus $1.88 million: $1.44 million on the winning side against $3.32 million on the losing side, with the two best leaders holding half of all the winnings and the ten worst carrying 43.6% of all the losses. When we first summed this board a week earlier the judged set of 749 leaders read minus $1.46 million; over the whole board, followed or not, the 12 September total is minus $2.20 million.

The gap, measured. Cross the two fields and the gap between the chart and the copy has a size. Of the 767 leaders who were up and whose followers had a reading, the followers' pool was in loss for 249 - 32.5% - and those 249 leaders carried 3,233 seats, nearly a fifth of all the seats on the board. The median leader in that group was up 23.8% with a drawdown of 27.8%, against 13.5% where leader and followers were both up. Followers who joined late, on a chart that had already climbed, and held through the fall, are the plausible mechanism; the platform does not publish entry dates, so the arithmetic is the closest thing to seeing it. The opposite corner exists too - 86 leaders down while their followers were up - and it is a third the size.
What moved the odds on this board, among leaders with a reading. Drawdown first: where the leader's worst fall stayed under 15%, the followers' pool was in profit 66.8% of the time; where it reached 50%, 15.7%, and that group alone lost $2.32 million, more than the board's whole net. The crowd second: the 31 leaders with a hundred or more followers had their pools in profit 55.2% of the time and were the only group whose pools summed to a plus, +$281,000, while leaders with one to four followers were in profit 43.8% of the time and lost $922,000 between them. Age, nothing: leaders older than two years had the lowest share of pools in profit of any age group, 39.8%. And the win rate cut both ways: leaders with a win rate of 90% or more had the highest share of leaders up, 84.7%, the highest share of pools in profit of any win-rate group, 64.4% - and the most negative total of any win-rate group, minus $994,000, because the pattern that produces a 97% win rate also produces the occasional fall that takes everything with it.
The same questions, side by side

| over the last ninety days | forex - RoboForex, 13 Sep | crypto - Bybit, 12 Sep |
|---|---|---|
| leaders or strategies with a follower | 2,428, holding 33,441 seats | 1,770, holding 17,872 seats |
| leaders up | 56.5% | 53.3% |
| seats on a leader who was up | 64.6% | 63.0% |
| seats whose copy was in profit | 57.7% - simulated, after the fee | 47.3% - as published, of seats with a reading |
| leaders whose worst fall reached half | 38.1% - worst single step | 34.1% - ninety-day drawdown |
| the fee the average seat signed up at | 27.6% | 10.1% |
At the leader level the two markets are the same place: a bit over half up, the seats a little more than that, the median near zero. The follower row is where they part, and the reason is mostly what each measure can see. The forex figure is a simulated follower who held exactly ninety days on a strategy that is still listed today or died within the last three weeks; it cannot see a real follower's late entry, early exit or sizing, and it cannot see anyone who died before 25 August. The crypto figure is money the platform measured, with every late entry and every panic exit in it, on a board that keeps its wiped accounts listed. Put the two side by side and the honest reading is not that forex works and crypto does not. It is that the simulated follower and the measured follower sit ten points apart, and the measured one is the one you would be.
What does differ between the markets is the fee and the fall. The forex seat is signed up at 27.6% of profit against 10.1% on the crypto board, and on the forex curves that fee moved 2.3% of all copies from above zero to below it and took the seat-weighted share in profit from 72.0% to 69.3% - four points on the strategies charging 30% or more, one point on those charging 5 to 15%. The crypto board's falls are deeper and faster - a third of followed leaders halved inside ninety days on the board's own drawdown figure, which is window-scoped and which we have seen reset, where the forex platform's "worst step" is a single move; neither is the follower's experience, and both flatter - and on the crypto board the halving group is where nearly all the money was lost.
So, does copy trading work?
For the leader, about half the time over any given quarter, on either market. For the follower, less often than for the leader - by a margin we could measure on the crypto board, where one leader in three who was up had followers who were down, and could only model on the forex list, where the fee alone took close to three points off the share of copies in profit and an entry after a strong quarter more than doubled the odds of losing half.
Whether it works for a particular follower is then decided by things neither board shows on the card. Which leader: on both platforms the crowd's picks did better than the field, and the size of the leader's worst fall separated the outcomes more sharply than anything else - from 66.8% of pools in profit to 15.7% on the crypto board, from 0.1% of copies halving to 8.5% on the forex list. How much of the money one leader gets: the crypto board's losses were concentrated in a handful of pools, the forex list's worst windows in a handful of strategies. How many leaders at once: the median leader on either board made a percent or two over the quarter, a margin that survives one bad pick only if it is not the only pick. And when to leave - the one variable no curve on either platform records.
We will re-run both computations as the panels grow; the forex departed set is three weeks old and will keep pulling the combined figures down as it fills. The mechanisms will not change: the card measures the leader, the copy starts where the follower starts, the fee is charged on the way up, and the list is what survived.
Every figure above is our own computation from the platforms' per-account figures: RoboForex curves and offers read on 13 September 2026 through the same public API the platform's own pages use, with the fee charged as its help pages describe; Bybit's per-leader board read on 12 September 2026. The forex follower outcomes are a model of the fee and the curve, not a follower's statement; the crypto ones are the platform's published pool per leader. Shares and sums are dated and will move with every reading. Copy trading carries real risk, and nothing above predicts future performance.
Related
View category
Copy Trading Commission: Does a Higher Fee Buy a Better Trader?
The fee tables explain what a copy trading commission is. None of them say whether it buys anything. We read the fee and the record of every strategy on one platform, the daily curve of the hundred most-followed, and every leader with a follower on another: what the rate predicts, what it does not, and how much more than the headline number it actually costs.
Read article →
Copy Trading Statistics: Is Copy Trading Profitable When Every Strategy Is Counted?
Broker pages answer whether copy trading is profitable with one leader’s chart. We read every strategy RoboForex CopyFX lists, every day, and summed the whole list: how many are underwater, where the followers’ money actually sits, how fast the list turns over, and why a long record proves survival rather than skill.
Read article →
Short Stop Is Law Review: A Gold Breakout EA on Six Accounts
Short Stop Is Law sits high in our CopyFX rating on a record with no double-digit fall. The same trader runs the same gold breakout EA on five other accounts, and three of them have already been through falls the listed one has not. What the whole family shows, what the fee history says, and how to size it.
Read article →