
Vendo DD50 Review: The Calmest of Four XAUUSD Copy Trading Strategies
Vendo DD50 has a 9.05% maximum drawdown across 26 months. The same trader also runs an account named DD30 that has lost 54.87%. What the four records show, what the drawdown figure really measures, and why no follower earned the headline 463.89%.
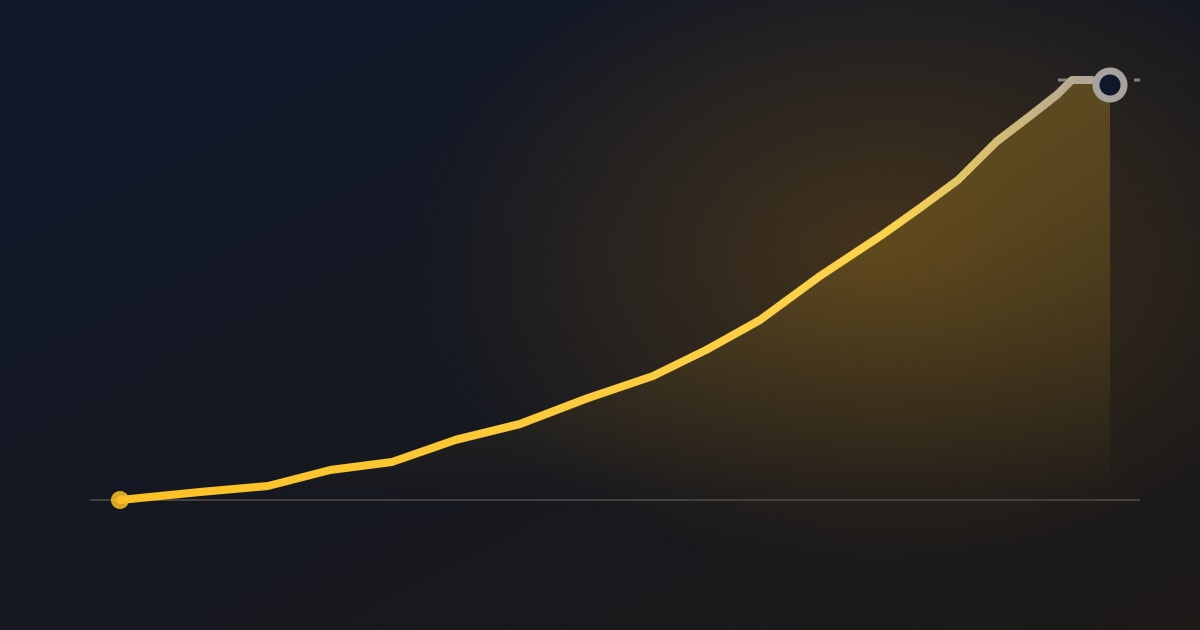
Vendo DD50 is the top-rated entry in our CopyFX ranking, and it earns that place on one number: a maximum drawdown of 9.05% across 26 months and 3,266 trades. For an XAUUSD copy trading strategy returning triple digits a year, that is unusually calm.
It is also not the only account this trader runs, and the other three are where the risk actually shows. All figures were read from RoboForex's own live data on 24 August 2026 and are a snapshot of that day.
The four accounts, and what their names do not mean
FhoenixTrade operates four strategies under one owner ID. Read the drawdown column against the number in each name.
| Strategy | All-time | Max drawdown | Copying | Since |
|---|---|---|---|---|
| Vendo DD70 | +3,162.85% | −39.74% | 91 | Jun 2023 |
| Vendo DD30 WL | +2,382.45% | −54.87% | 50 | Aug 2023 |
| Vendo DD50 | +463.89% | −9.05% | 359 | Jun 2024 |
| Vendo IntraWeek MT5 | +39.58% | −6.18% | 34 | May 2026 |
The obvious reading of "DD50" is a drawdown ceiling. The data says otherwise: the account named DD30 has lost 54.87% — nearly twice its own number — while DD70 lost 39.74% and DD50 lost 9.05%. Whatever the numbers are, they are not limits that were kept, and they are not descriptions of what happened.
That matters because it is the same operator, the same style and the same fee across all four. Vendo DD50 is the calmest thing he runs. It is not evidence that he only runs calm things.
What the account is
| Strategy | Vendo DD50 (trader FhoenixTrade, account 46128381) |
| Running since | 16 June 2024 — 26 months |
| Instrument | XAUUSD, gold against the dollar |
| Platform | MT4, cent account, leverage 1:300 |
| Minimum to follow | $100 |
| Trader's fee | 30% of your profit, settled weekly |
| People copying it | 359 |
The record
| Window | Return | Max drawdown |
|---|---|---|
| All time (26 months) | +463.89% | −9.05% |
| Last year | +136.37% | −4.08% |
| Last 6 months | +42.33% | −3.03% |
| Last 3 months | +12.63% | −3.03% |
| Last month | −1.07% | −3.03% |
| Last week | +4.51% | −0.84% |
One caution on the source before anything is read into it. RoboForex's API reports trade counts that cannot all be true — the six-month window returns fewer trades than the fortnight inside it — so only the all-time figure (3,266) and the one-year figure (1,338) are quoted anywhere on this page. The return and drawdown columns are internally consistent; the trade counts on the middle windows are not.
It faded. It did not collapse
Those windows all overlap, and each shorter one contains the same recent weak patch at a heavier weight — so they decline in sequence no matter what the strategy did. Reading a collapse off them would be an artefact of the arithmetic.
Dividing the nested figures into consecutive, non-overlapping periods gives the real shape.

The strategy accelerated into early 2026, then faded gently across three consecutive quarters — 176%, 155%, 118% annualised — and then had one losing month. Inside that month the trough was 5.34% below where it started, and the most recent week has already recovered roughly half of it.
That is a fade, and it is worth watching. It is not a strategy falling apart.
There is a fourth reading the numbers support well: it is being run smaller. Trade activity is down about 20% from the first year, drawdowns have tightened from 9.05% lifetime to 4.08% over a year to 3.03% over six months, and return per unit of drawdown is essentially unchanged — 33.4 over one year against 33.9 over six months. Lower returns at proportionally lower risk is a different thing from an edge decaying.
The drawdown is the achievement, with one caveat
A −9.05% worst case across 3,266 trades and 26 months is genuinely hard to produce. Most accounts posting a 400%+ lifetime return got there by taking losses several times that deep. This one did not, and that is the case for it.
The caveat is that RoboForex's drawdown figure does not measure what most readers assume. Take its own numbers: the trailing month is −1.07% and the trailing week is +4.51%, which forces equity a week ago to have been 5.34% below where it stood a month earlier. A true peak-to-trough drawdown across that window is therefore at least 5.34% — but the same API reports the month's maximum drawdown as 3.03%.
Whatever it measures — closed balances rather than floating equity, a daily series, a per-trade figure — it is smaller than the decline a follower would have watched in their account. The 9.05% is real as a comparison between accounts on the same platform. It is not the worst you would have felt.
That is still a different animal from an account like SARUJA AI, which lost its entire gain in four days. The shape here is an ordinary, visible losing stretch, not a cliff.
It trades gold, but it is not a bet on gold going up
Gold roughly doubled over this account's life — about +101% from June 2024 to August 2026 — so the obvious suspicion is that a gold-only strategy simply rode it.
Three things in the record rule that out.
- It returned +42.33% over six months in which gold fell about 7%.
- It came through gold's −28% slide from the January 2026 high, including its worst quarter since 2013, with a lifetime maximum drawdown of 9.05%. A leveraged long would not have survived that.
- It lost money in gold's best month of the year — down 1.07% while gold gained around 14.5%.
What the account looks like instead is an intraday breakout system trading both sides of the daily range, at about 5.9 trades per trading day. That kind of system is paid by movement, not by direction. Which reframes the real risk: the regime that hurts it is not a gold bear market, which it has already traded through profitably. It is a quiet, tightly-ranging gold market — often exactly what follows a violent round trip. The last month, losing while gold ground steadily upward, is the first data point with that shape.
The trader started with $100
The account being copied is a cent account holding $564.13. Its all-time profit in money is $463.50 — which means it started with $100.63, the platform minimum. And 359 people copy it.
What that does not mean is that your returns are capped. CopyFX scales to your own equity, so a small master does not limit a larger follower.
What it does mean is worth being blunt about. The person setting the trades has a few hundred dollars at risk and earns 30% of the profits of everyone copying him, settled weekly. On any plausible follower book, his fee income is one to two orders of magnitude larger than his own trading result. That is the ordinary shape of a performance-fee product rather than evidence of anything wrong — but the payoff he is optimising is not the payoff you have.
A cent account is also a sensible choice for a small master, not a red flag: a cent lot is 1/100 of a standard lot, so he can size positions 100× more finely than the same money on a standard account. The catch lands on you. A standard-account follower's smallest position is 100× coarser than his, so signals that scale below your minimum lot get rounded up or dropped — and that distortion is proportionally worst for the smallest accounts, meaning at the advertised $100 entry. Expect your curve to diverge visibly from the published one.
What you actually pay, and what nobody earned
The fee is 30% of your profit, charged weekly, only on profit. A losing week costs nothing.
| On a $1,000 stake, in a week returning 4.51% | |
|---|---|
| Your gross profit | $45.10 |
| Trader's 30% | −$13.53 |
| You keep | $31.57 |
Which leads to the number that matters most on this page. The +463.89% is the master's gross return, and no follower earned it. Take 30% of the profits along the way and the realistic figure is roughly +290% before any execution difference — still an excellent result over 26 months, and roughly 170 percentage points below the headline.
Weekly settlement is sharper than it sounds, too. A strategy that gains 10% one week and loses 8% the next has charged you on the 10% and returned nothing on the 8%. Worked against live data: the account is down on the month, so the +4.51% recovery week did not reach a new high and billed no fee at all — you paid nothing, and you were also still down.
The edge is thin, and thin edges are fragile
3,266 trades compounding to 5.64× works out to an average of 5.3 basis points of equity per trade. That is the entire track record.
Sensitivity, on the same arithmetic: shave one basis point per trade and 26 months returns +307% instead of +464%. Shave two and it is +194%.
Two basis points is not much. It is the difference between a good fill and a poor one, and gold spreads widen precisely at the moments a breakout system enters. It is also worth checking your account type before funding: RoboForex nets per-lot commissions on ECN-style accounts out of the profit the fee is calculated on, and a strategy turning over roughly 124 trades a month pays that charge a great many times. On a 5.3bp edge, a commission-bearing account is a materially different product from a spread-only one.
Whether real follower slippage reaches two basis points is not something public data can answer. Treat it as the threshold to watch rather than a measured loss.
What the rating does not filter out
This applies to every strategy on the platform, not just this one.
RoboForex's help centre states that trader accounts are automatically included in the rating except for accounts with equity under 50 USD for more than three days, accounts not set to show, accounts without subscription conditions set — and accounts with a yield of −90% or lower for 10 consecutive days.
RoboForex describes those rules as ensuring the rating "displays active and reliable Traders". Read it again: an account that has lost 89% of its investors' money is an active and reliable trader by that definition. The rating is not a quality filter. It is a filter for near-total destruction, and everything above that line stays listed automatically.
Which is why we rank these accounts ourselves rather than reprinting the platform's order, and why the drawdown column carries more weight here than the return column. The same broker's own disclosure, at the foot of the page you would sign up on, says 75.85% of retail investor accounts lose money trading CFDs with it.
What the trader claims, and whether it holds
The strategy's description advertises "APY 90-120%". Measured over 799 days, the realised figure is 120.5% a year — almost exactly the top of the stated band. Over the trailing twelve months it is 136%, above it. Over the last three months it is 61%, below it.
So the number is, unusually for this corner of the internet, roughly honest. The misleading part is the word. "APY" belongs to savings products and implies a contracted compounding rate; a narrow 90–120% band is not an honest forecast shape for a leveraged directional-volatility system whose entire 26-month sample was drawn from the most turbulent gold market in over a decade.
On the martingale question, which is fair to ask of any account with a 9.05% drawdown and a 460% return: the evidence points against it. A martingale produces a smooth line and then a cliff. This account shows an ordinary visible losing stretch and held a 4.08% drawdown through a year in which gold fell 28% from its high. Both are the wrong shape for a system that refuses to close losers.
What would tell you it has broken
A bad month is not a broken strategy. These are, anchored to the account's own baselines rather than round numbers:
- The all-time drawdown figure rising above 9.05%. It is a ratchet — it only moves when a new worst-ever drawdown happens. And because it understates the real decline, a breach is more alarming than it looks.
- A negative trailing quarter. Every completed quarter so far has been strongly positive. A negative one breaks all precedent.
- A losing week in which gold moved violently. This system is paid to harvest movement. Losing in a quiet week is forgivable; losing in a wild one means the edge itself stopped working. The last month is a soft warning of exactly this shape.
- Monthly trade count leaving the 100–135 band. Far below means he has stopped running the system; far above means position escalation.
- The fee dropping from 30% toward zero, or position sizes growing after losses. A trader cutting his own fee is usually trying to stop people leaving.
Where it stands
Vendo DD50 is the calmest account we rate, its drawdown record is genuinely rare, and it is coming off its first losing month in a long run — all three at once.
If you follow it, follow it knowing you are buying a single-instrument gold strategy that is paid by volatility rather than direction, run on a $564 master account by someone who also runs a strategy that has lost 55%, on a platform that will keep listing it until it has lost 90%. The realistic net return is nearer +290% than the +463.89% on the page.
None of that is a reason not to copy it. They are the things the headline does not tell you.
We re-check these figures monthly and date the page each time. The current ranking, and the accounts we rate it against, are on the CopyFX rating.
Related
View category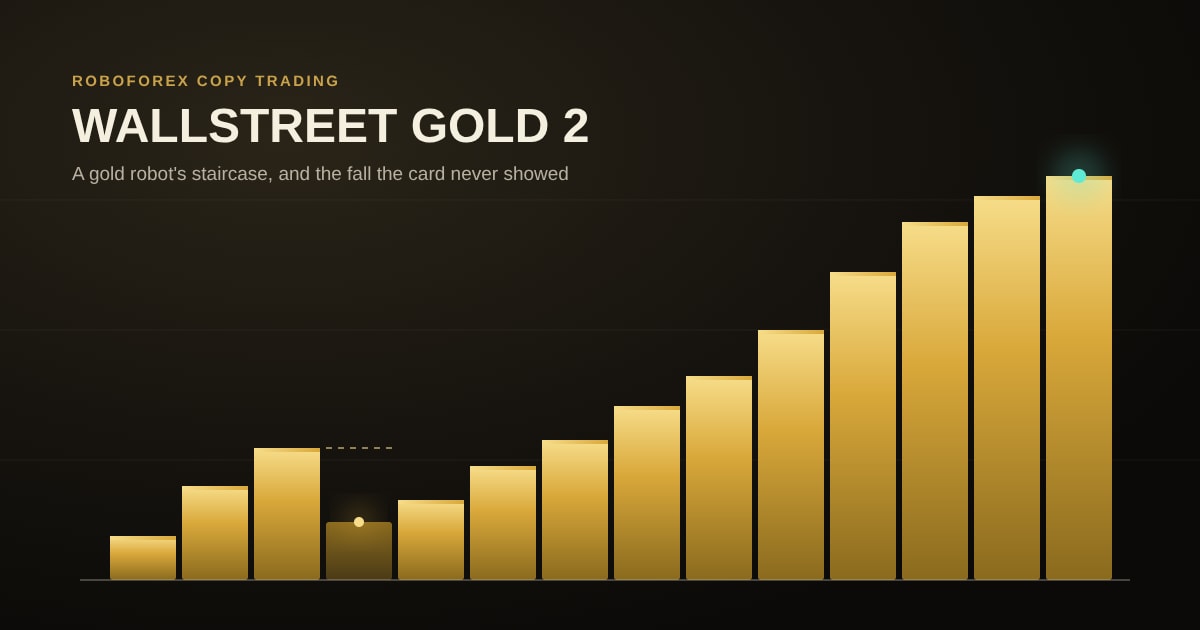
WALLSTREET GOLD 2 Review: XAUUSD Copy Trading as a Staircase, Not a Spike
WALLSTREET GOLD 2 is one of the most-copied accounts in our CopyFX rating: a gold-only robot with a staircase record and a card whose drawdown figure understates its worst fall. The card never showed the account's first-year fall, and the trader's original account on the same robot has taken a fall this one has not. What the full record shows, what the fee really takes, and how to size it.
Read article →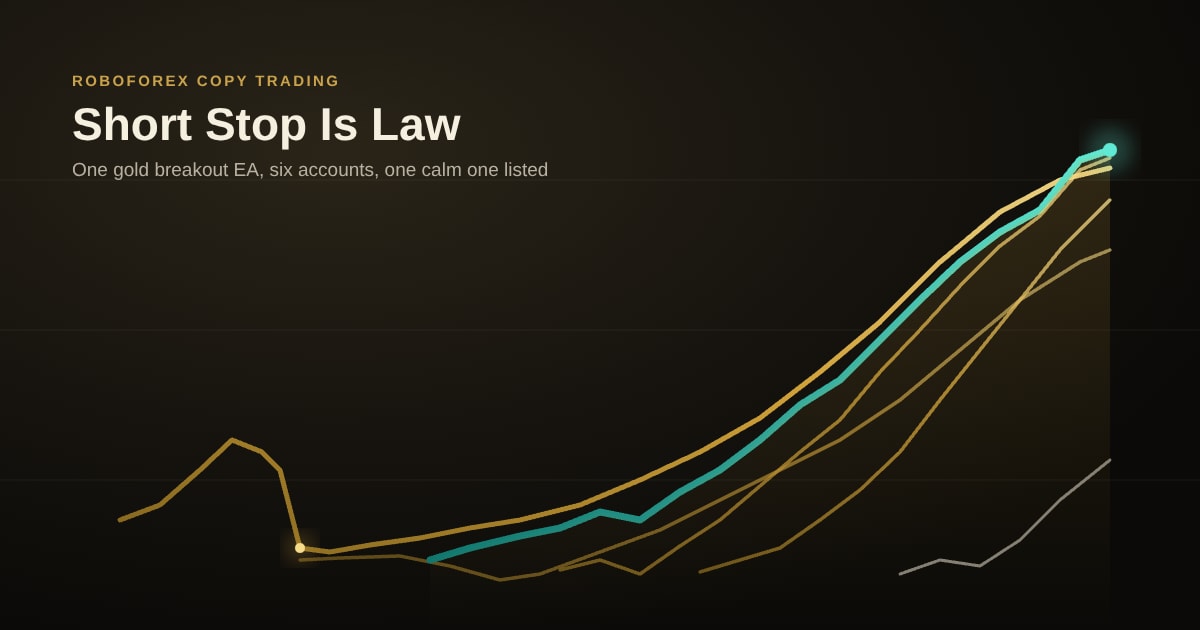
Short Stop Is Law Review: A Gold Breakout EA on Six Accounts
Short Stop Is Law sits high in our CopyFX rating on a record with no double-digit fall. The same trader runs the same gold breakout EA on five other accounts, and three of them have already been through falls the listed one has not. What the whole family shows, what the fee history says, and how to size it.
Read article →
Copy Trading Commission: Does a Higher Fee Buy a Better Trader?
The fee tables explain what a copy trading commission is. None of them say whether it buys anything. We read the fee and the record of every strategy on one platform, the daily curve of the hundred most-followed, and every leader with a follower on another: what the rate predicts, what it does not, and how much more than the headline number it actually costs.
Read article →