
What Is Drawdown in Trading? Max Drawdown on Real Curves
Drawdown is the fall from a peak, measured as a share of the peak, and the climb back is always larger than the fall. What the three MetaTrader figures mean, what the fall usually looks like on thousands of real copy-trading curves, and why the number on a strategy card and the number on its chart are two different drawdowns.
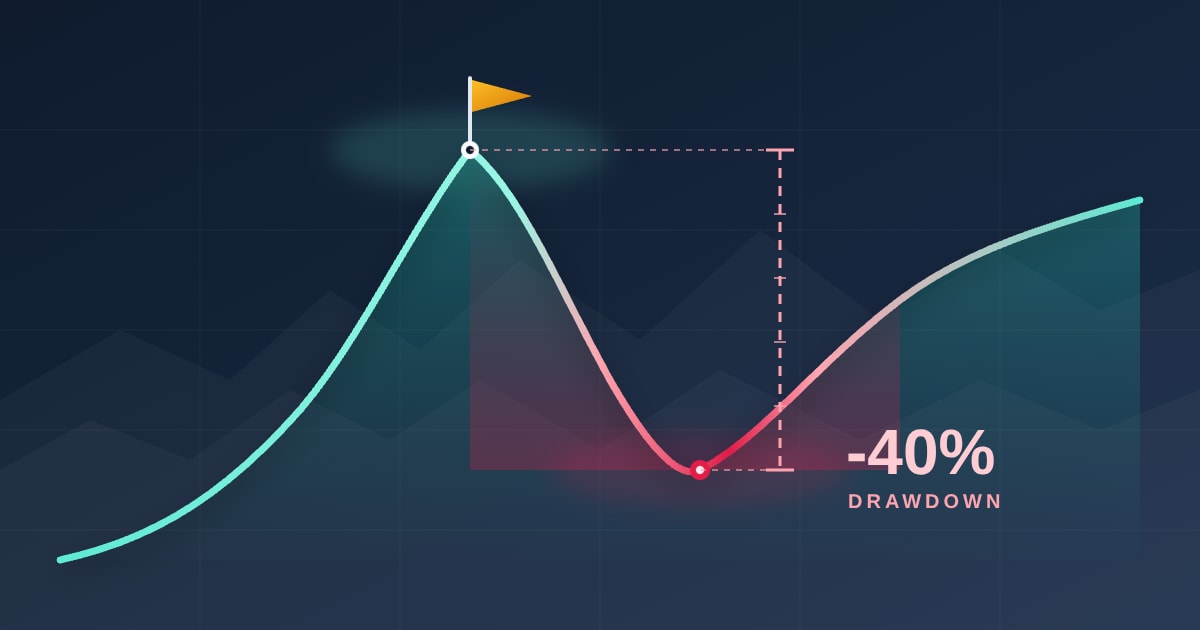
What is drawdown in trading? It is how far an account has fallen from its highest point, measured as a share of that high. An account that grew to 12,000 dollars and now stands at 9,000 is in a 25% drawdown, whatever it started with and whatever it has earned since day one. Maximum drawdown is the largest such fall anywhere in the record. That is the whole definition, and the rest of this page is about what the number hides: which high it is measured from, which low it stops at, what it takes to climb back, and why the drawdown printed on a copy-trading card is often not the drawdown a follower lived through.
The second half of the page is built on real curves. We hold the full daily yield history of every copied strategy on RoboForex's copy-trading service and the leader board of Bybit's, and on 11 October 2026 we measured the peak-to-trough fall of all of them. Those figures are the honest answer to "what is a good drawdown", and they are not the answer most guides give.
What drawdown in trading means, with an example
Take an account that starts at 10,000, rises to 12,000, falls to 9,000 and later climbs back above 12,000. Its drawdown at the bottom was 3,000 dollars, or 25% of the 12,000 peak. Three details in that sentence do most of the work.
It is measured from the peak, not from the deposit. The account at 9,000 was still 10% below its starting money, but the drawdown was 25%, because the question drawdown answers is "how much of what I had at the best moment is gone". A trader who joined at the peak lost 25%; the deposit is irrelevant to them.
It is a share of the peak, so the climb back is a share of the trough. Falling 25% from 12,000 leaves 9,000; getting from 9,000 back to 12,000 is a 33% gain. The two percentages are never the same number, and the gap widens fast as the fall deepens. More on that below, because it is the single most useful thing to know about the subject.
Maximum drawdown is a record, not a state. The account is now above its old high, so its current drawdown is zero, but its maximum drawdown is still 25% and always will be unless something worse happens. A strategy's "max drawdown" tells you the deepest hole it has ever been in, not where it is today.

The diagram adds the one measure most cards leave out: time under water, every day spent below the old peak. A 40% fall that is repaired in a fortnight and a 40% fall that lasts eleven months are the same maximum drawdown and very different experiences, and the second kind is far more common than the first.
Absolute, maximal and relative: the three numbers in a MetaTrader report
The reason "relative drawdown" and "equity drawdown maximal vs relative" are searched so often is MetaTrader's strategy tester, which prints six drawdown figures and explains none of them on the report itself. Its own help page does, and the definitions are short enough to quote.
The MetaTrader 5 report defines Balance Drawdown Absolute as the "difference between the initial deposit and the minimal level below initial deposit throughout the whole testing period"; Balance Drawdown Maximal as the "difference in deposit currency between the highest local balance value and the next lowest account balance value", with the percentage in brackets; and Balance Drawdown Relative as the "difference in percentage terms between the highest local balance value and the next lowest account balance value", with the money in brackets. The same three are then repeated for equity. The MetaTrader 4 report prints the same three names without the balance-and-equity split.
Read them this way:
| Figure | What it measures | When it matters |
|---|---|---|
| Absolute | How far below the starting deposit the account ever went | Only early in a record; once the account has grown, it stays at zero forever |
| Maximal | The largest fall from a peak, in money | For a fixed-size account or a backtest with no deposits; the money figure grows with the account |
| Relative | The largest fall from a peak, as a percentage of that peak | The one to compare between accounts and over time; it is what "max drawdown" means everywhere else |
Two of the three are easy to misread. Absolute drawdown looks reassuring on any account that has been profitable for a while, because it measures the dip below the first deposit and nothing after. Maximal drawdown in money can be the largest fall late in a successful record and a small percentage, or a modest sum early on and a large percentage. Relative drawdown is the figure that means the same thing on a 500-dollar account and a 500,000-dollar one, and it is the one every figure on this page uses.
The balance-versus-equity split is the other trap. Balance moves only when a trade closes; equity includes open profit and loss. A strategy that holds losing positions open for weeks can show a flat balance drawdown and a deep equity drawdown at the same time, and the equity one is the real one, because equity is what the account is worth and what a stop out is measured on. The same rule that governs leverage governs this: as our page on what is leverage in forex walks through, the broker watches equity, not balance, and so should you.
The report also prints a recovery factor, the "ratio of gained profit to the maximum drawdown". It is the quickest sanity check on any record: a strategy that made 40% while falling 40% along the way has a recovery factor of one, which means it earned exactly what it put at risk once, and nothing about that is a track record yet.
The arithmetic nobody likes: what it takes to get back
A drawdown is measured from the top, a recovery from the bottom, so the gain needed to undo a fall is always larger than the fall. The formula is the fall divided by what is left: after a 40% fall, 40 divided by 60, which is 67%.
| After a fall of | The gain needed to get back to the peak |
|---|---|
| 10% | 11% |
| 20% | 25% |
| 30% | 43% |
| 40% | 67% |
| 50% | 100% |
| 60% | 150% |
| 70% | 233% |
| 80% | 400% |
| 90% | 900% |
The table is why a 50% drawdown is treated as a different kind of event from a 25% one rather than merely twice as bad. Below about 20% the climb back is in reach of an ordinary good quarter. At 50% the strategy has to double, which is a record most strategies never post even once. At 90% it has to grow tenfold, and in practice an account that has lost nine tenths is running a different, much smaller strategy with the same name on it.
What the real curves did after a fall matches that arithmetic closely.

Of the 883 curves that fell between 20% and 50% at some point, 43.5% had got back to the peak they fell from by 11 October; the typical fall took 18 days and the typical repair, for those that managed it, 11 days, with a quarter of repairs taking more than 45. Of the 1,549 curves that fell 50% or more, 13.1% ever returned to the peak, and 92.6% were still at least 10% below it on the day we read them. Counting only the strategies still listed on the platform, which excludes the ones it has removed, the share repaired after a 50% fall is 21.8%; the delisting rule is the reason the two shares differ, and we come back to it.
Time under water is the measure that makes those shares concrete. Across all 3,377 curves the median strategy spent 68.7% of its days below its own running peak. Among the curves that ended in profit, the share was still 57.9%. A profitable record is mostly days of being behind.
What drawdown looks like on real copy-trading curves
Every guide tells you to check a strategy's maximum drawdown before copying it. Almost none tells you what the number usually is. Here is the distribution for the 2,377 strategies on RoboForex's copy-trading service that had at least one follower on 11 October 2026, measured peak to trough on each strategy's full daily yield curve since its first trade.

The median listed strategy had fallen 33.8% from a high at some point; a quarter had fallen 62.4% or more; more than a third, 34.7%, had at some point lost half. Only 25.7% had never fallen 15%, and they held 16.2% of the follower seats, so followers are, on the whole, sitting on deeper falls than the list average. The deepest group, strategies that at some point lost 90% or more, was 7.2% of the list and still held 1,810 seats.
The relationship with results is the one the arithmetic predicts. Of the strategies whose worst fall stayed under 15%, 87.4% were in profit on the day we read them; at 15 to 30%, 78.6%; at 30 to 50%, 70.3%; at 50 to 90%, fewer than half, 48.2%; at 90% or worse, 14.0%. Put the other way round: the strategies that ended in profit had a median worst fall of 24.9%, the ones that ended in loss 60.9%. Drawdown is not just a risk figure beside the return; past a certain depth it is the return.
Three things about the distribution are easy to miss.
The number grows with the record. Strategies younger than 90 days had a median worst fall of 37.7% and a third of them had never fallen 15%; strategies a year or older had a median of 51.0% and fewer than one in ten, 9.6%, had stayed under 15%. A low drawdown on a three-month-old curve is mostly a statement about how little has happened to it yet. The combination people actually want, a strategy at least a year old whose worst fall is under 15%, described 87 of the 2,377 listed strategies, 3.7% of the list, holding 2.7% of the seats.
The list you can see is the list after the removals. RoboForex removes a strategy from its rating once its yield has sat at or below minus 90% for ten days. Our universe also includes 1,000 accounts our daily record had seen with followers and which were absent from the list on 11 October. Their median worst fall was 91.6%, and 72.5% had lost half or more. Add them back and the median across all 3,377 curves rises from 33.8% to 44.8%, with 45.9% having halved at some point. Our statistics on the copy-trading panel cover that survivorship in more detail; the short version is that the rating is a filter for near-total destruction, not for quality, and a drawdown distribution read off the visible list is the flattering one.
Half the list is in a drawdown right now. On the day of the reading, 55.4% of listed strategies, carrying 59.5% of the seats, stood at least 10% below their own peak, and only 25.7% were at a new high. A follower joining at random joins a strategy that is behind more often than not, which matters because, as the platform-neutral study of how to choose a copy trader found on the same curves, the depth of the fall a strategy had already shown on the day of entry changed the odds: ninety-day copies started when the curve's worst fall so far was under 15% ended in profit 62.8% of the time and lost half or more 2.0% of the time, against 51.9% and 4.3% when the fall had already reached 50%.
The card and the curve are two different drawdowns
Here is the finding we did not expect. The "Max drawdown" printed on each RoboForex strategy card is a real number, read from the platform's own daily series. It is just not the peak-to-trough fall of the curve, and the two disagree in both directions.

The platform serves, next to each card, the daily series behind its drawdown figure, and the series shows what the figure is: a reading taken within each day on the account's equity, floating loss included, which resets to zero whenever the account makes a new high and does not carry over from one day to the next. The card's number is the worst of those days. It is a genuine measure, and for one kind of strategy it is the stricter one: a gold strategy copied by about 180 accounts shows a card drawdown of 53%, almost all of it from one day in April on which its open positions were 50.7% under water at the worst point and which closed about 6% down; its daily closing curve never fell more than 7% from a high. The card caught an air pocket the curve cannot see.
For the opposite kind of strategy the card is the lenient one. Vendo DD50, which led our rating until September, carries a card figure of 9.05%; its curve fell 37.5% between 26 August and 11 September 2024, a slide of two weeks during which the card's own daily series never read worse than 9%, before recovering. A strategy with more than 400 seats shows 7.9% on its card and a 38% decline on its curve that began in October 2024 and had not been repaired by October 2026. On the card's own daily series, neither account ever read worse than 10%; peak to trough, a third of the money was gone.
Across the 2,377 listed strategies the two readings land in the same range only 58.4% of the time. For 12.9% the card is at least twice the curve, for 11.7% the curve is at least twice the card. Of the 521 cards showing a drawdown under 15%, the curve agreed for 67.2%; for 12.9% it had fallen 30% or more, and for 22 of them the strategy had at some point lost half. Take the worse of the two readings for each strategy and the median worst fall of the list is 45.6%, with 45.6% of strategies and 42.4% of seats having lost half or more at some point by one measure or the other.
That is also what the figure on this site does. Our copy-trading rating scores the worst fall as the largest of several readings: the card's figure, the fall on the full curve, the current distance below the peak and the worst we have recorded ourselves; the weights are on the methodology page. A reader with only the card and the chart can do the same by hand: read the card's "Max drawdown", then open the yield chart on its "All" period and look for the deepest fall from any high. Whichever is worse is the drawdown.
Bybit's copy-trading board makes a different simplification. Its card prints a maximum drawdown over the window selected, the trailing 90 days in the view we read, measured inside that window and reset as it moves; a leader's worst quarter drops off the card ninety days after it ends. On 11 October, among the 1,802 leaders on the Bybit board with at least one follower, the median 90-day drawdown was 24.7% and 32.6% of leaders had lost half or more inside the quarter, carrying 21.6% of the follower seats. The link to results is as steep as on the forex side: 76.5% of leaders whose quarter's fall stayed under 15% had a positive 90-day ROI, with a median of +7.3%; of those whose fall reached 50%, 20.7% did, with a median ROI of minus 50%. The seats, as on RoboForex, lean toward the calmer group: 45.6% of them sat on leaders under 15%.
One more reading of the card deserves a name, because it is the most expensive one. A smooth, steadily rising curve with a modest drawdown figure is the shape produced by holding losing positions open and adding to them, and it stays modest until it does not: the most-copied strategy on RoboForex went from a card drawdown around 63% to minus 99.2% in about a week. How a martingale shows up in public statistics is the companion page to this one; the drawdown chart's occasional deep spikes in an otherwise calm record are its signature.
Drawdown rules at prop firms
Funded-account programs turn drawdown from a statistic into a rule with consequences, which is why "max drawdown prop firm" and "eod drawdown" are among the most searched forms of the phrase. The rules come in three shapes: a static maximum loss measured from the starting balance, a trailing one measured from the account's high-water mark that follows the account up and never comes back down, and a daily limit that resets on a clock, usually measured on equity rather than balance. "EOD" is the end-of-day variant of the trailing rule, which moves the floor only on closed profit rather than on an intraday spike. The differences decide whether a profitable trader survives a normal losing week, and the prop-firm drawdown rules page walks through all three with the actual terms of the firms in our rating, including the one that closes the account at break-even.
What is a good drawdown in trading
The honest answer is that there is no good drawdown, only one that is small relative to the return it bought and to the time you are prepared to wait. Three rules of thumb follow from the curves above.
Read it against the return and the age. A 20% worst fall on a strategy that has made 15% in three years and a 20% worst fall on one that has made 300% in two are not the same risk, and neither is a 20% fall on a record that is nine weeks old. The recovery factor, profit divided by maximum drawdown, is the one-line version; anything below one has not yet earned what it risked, and a record under a year old has usually not yet met its drawdown at all.
Decide the depth you can hold, then size for it. The arithmetic table is a budget. If a 30% fall would make you stop copying, then a strategy whose worst fall by either reading is already 30% is one you will leave at the bottom, which is the worst possible day to leave. The allocation to a strategy, not the strategy's own figure, is what sets your drawdown: half your money in a strategy that falls 40% is a 20% drawdown for you, and the position size calculator does the same arithmetic for a single trade from the loss you are willing to take.
Prefer the strategy that is past its worst to the one that has not had one. Of the 2,377 listed strategies, the quiet, year-old, under-15% group was 87. Everyone else has either fallen hard or not been around long enough to. Between a curve that fell 30%, repaired it and kept going, and a curve that has never fallen because it has existed for sixty days, the first has told you something and the second has not.
Bottom line
Drawdown is the fall from a peak, measured as a share of the peak; maximum drawdown is the deepest such fall in the record; relative drawdown is MetaTrader's name for the same percentage, and the only one of its six figures worth comparing between accounts. A fall is undone by a larger gain than the fall, and on real copy-trading curves most falls of 50% or more are never undone at all. The drawdown on a strategy card and the drawdown on its curve measure different things, agree only three times in five, and the follower's drawdown is at least the worse of the two. Read both, size your allocation for the deeper one, and treat a low figure on a young record as the absence of evidence rather than the presence of safety.
Related
View category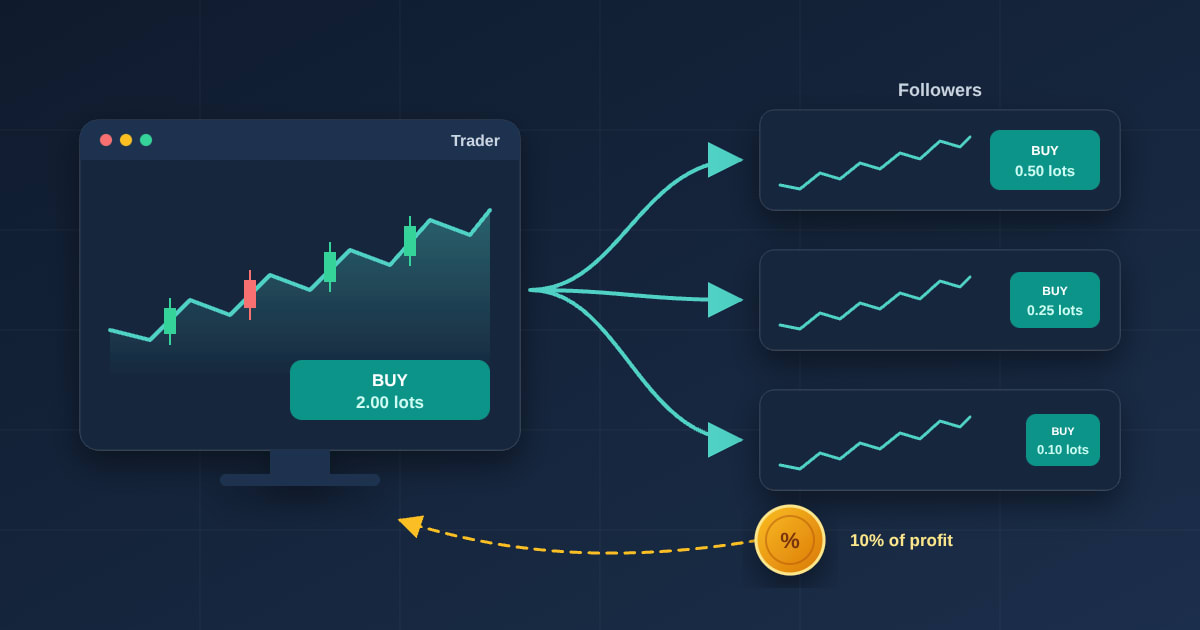
What Is Copy Trading and How It Works
Copy trading is a subscription that makes your account repeat another trader's trades, sized to your money, for a share of the profit. How a trade is copied and sized, what the fee actually charges on a forex broker and a crypto exchange, what the card shows and hides, and what our own data says the follower gets.
Read article →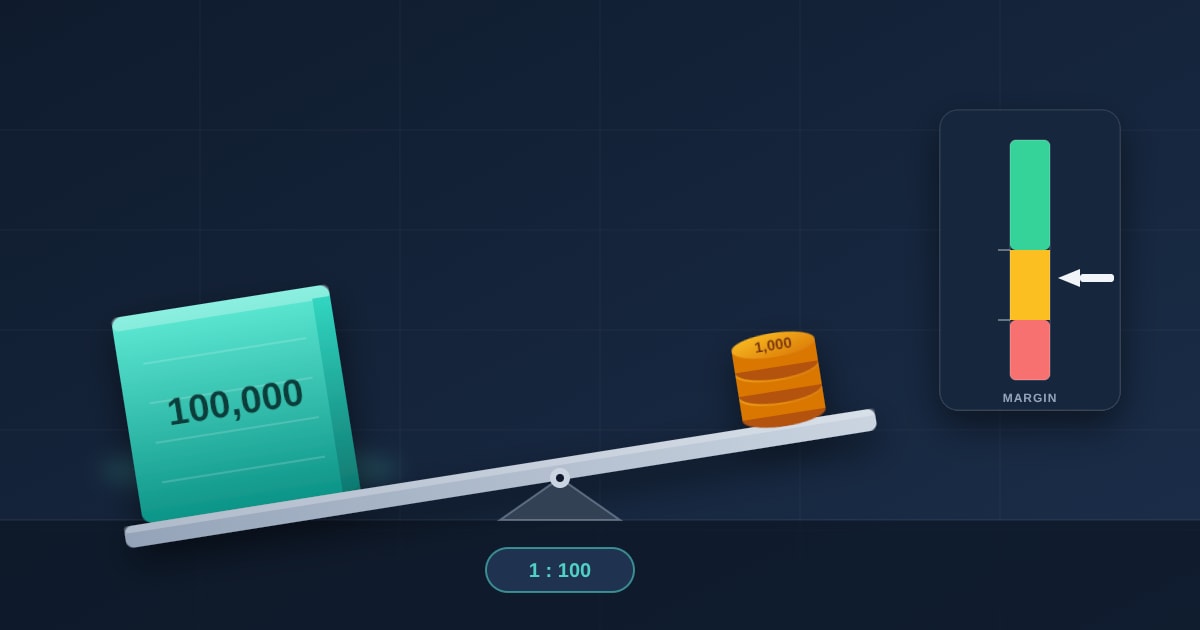
What Is Leverage in Forex? Margin, Margin Call and Stop Out, One Chain
Leverage sets the margin, the margin sets the margin level, and the margin level is what a margin call and a stop out are measured on. One 1,000-dollar account carried through the whole chain, the levels each of the twenty brokers we rate publishes, and where negative balance protection applies.
Read article →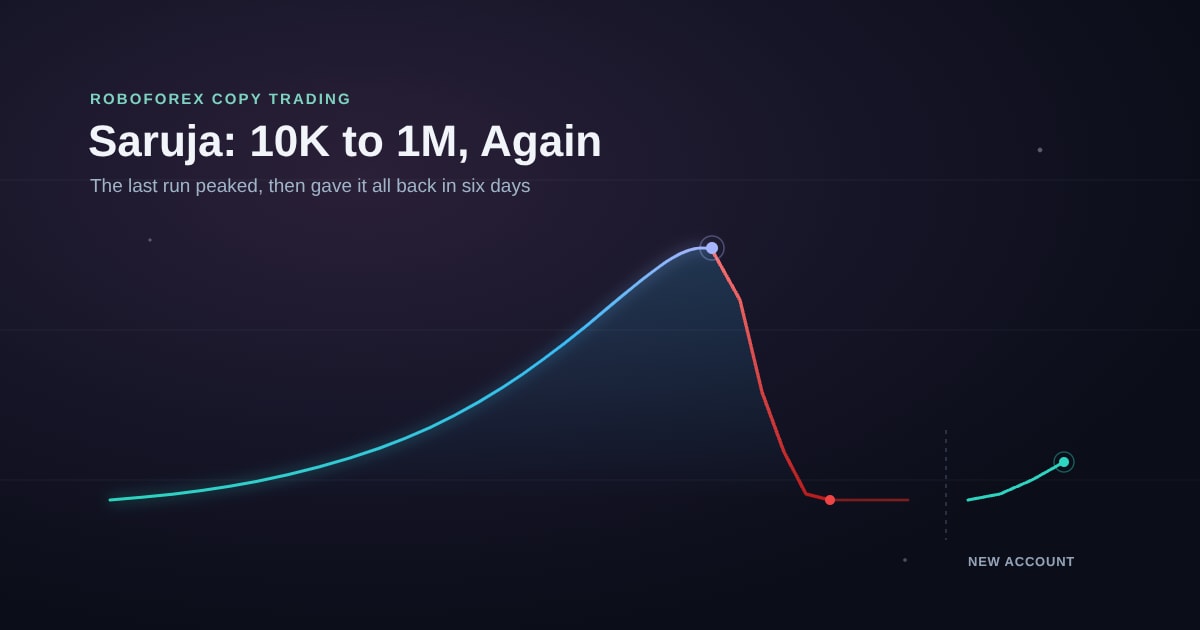
Saruja 10K to 1M Journey: The New Account, and What the Last One Did
Trading has started on the account behind the Saruja 10K to 1M journey. The same operator’s last account made a very large return and then gave all of it back in under a week — which is both the case for copying this one and the reason to keep it small.
Read article →